Households in Zurich
A Look at Demographic Data in the City of Zurich
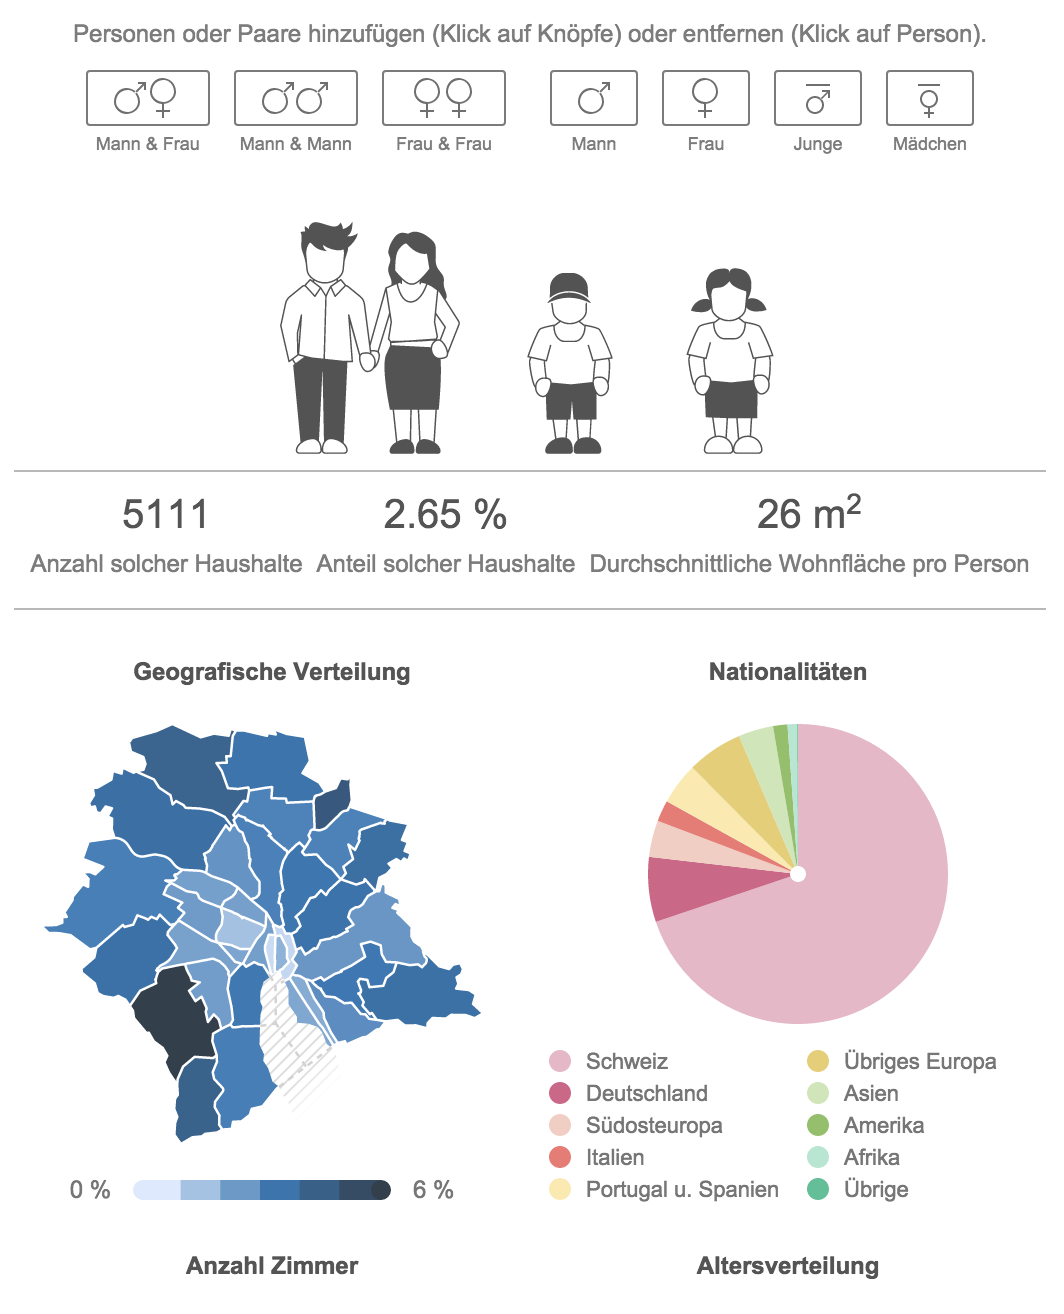
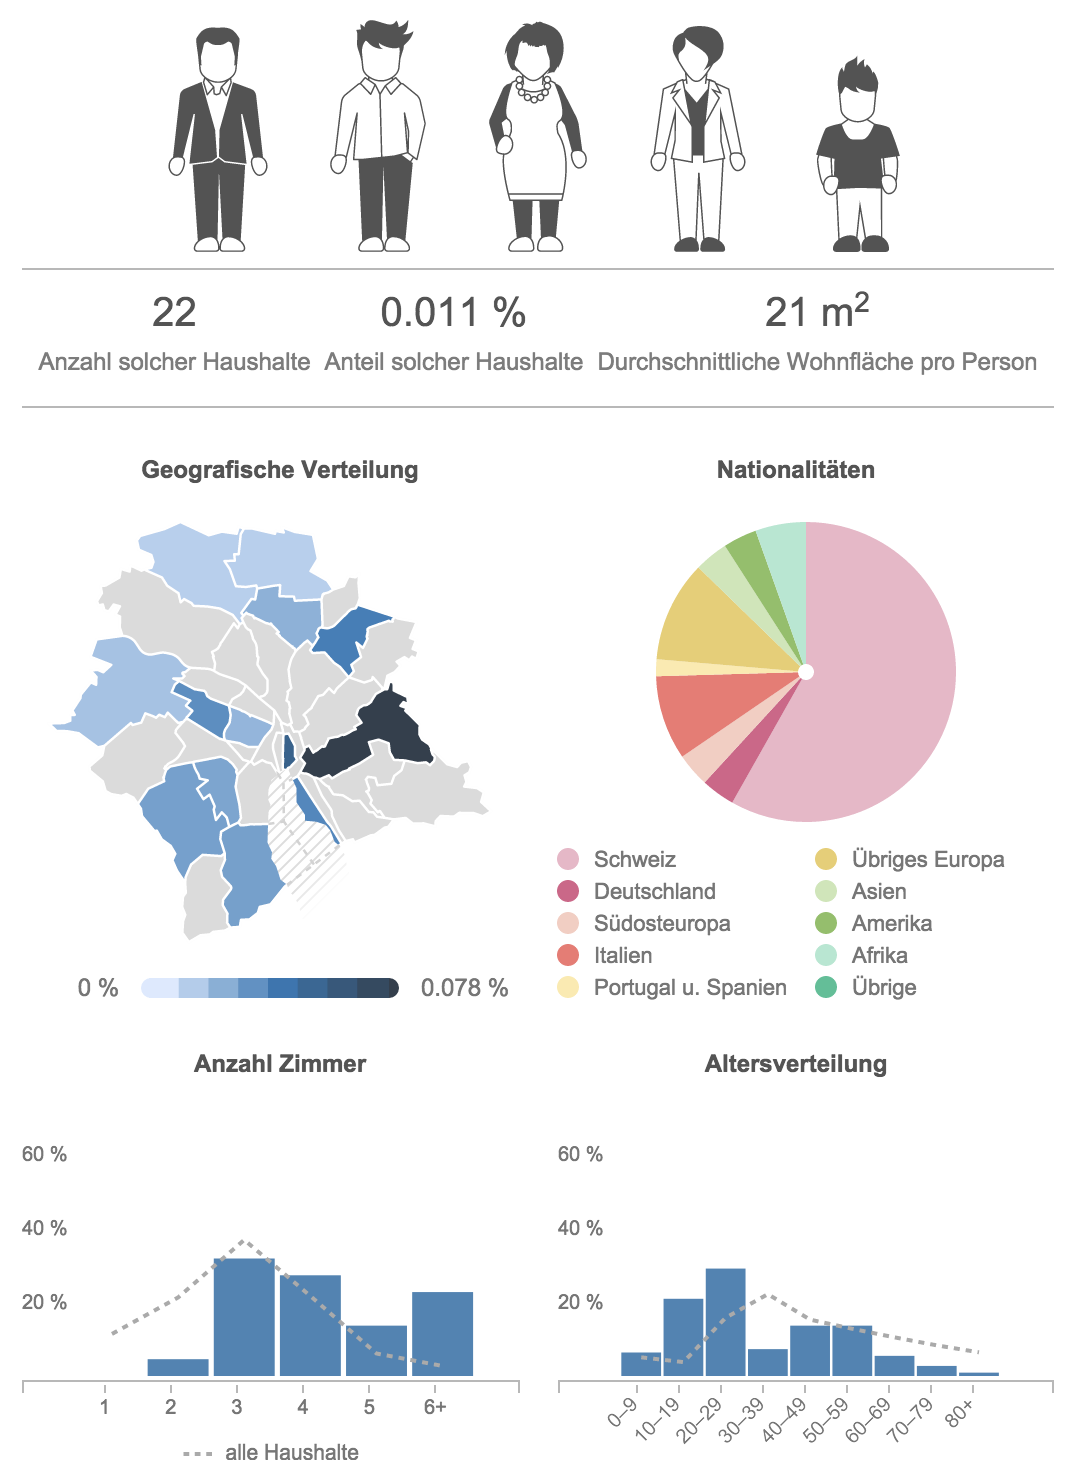
This visualization was developed in collaboration with the statistical office of the city of Zurich, and used the library we had previously developed for them. A team at Interactive Things created a complex visualization with several coordinated charts, that was driven by a unique filter-selection mechanism. It also involved working with an illustrator to create the character personalities of the household group.